


OfferUp 2020 Recommerce report
OfferUp internal project
Feb. 2020 - April 2020
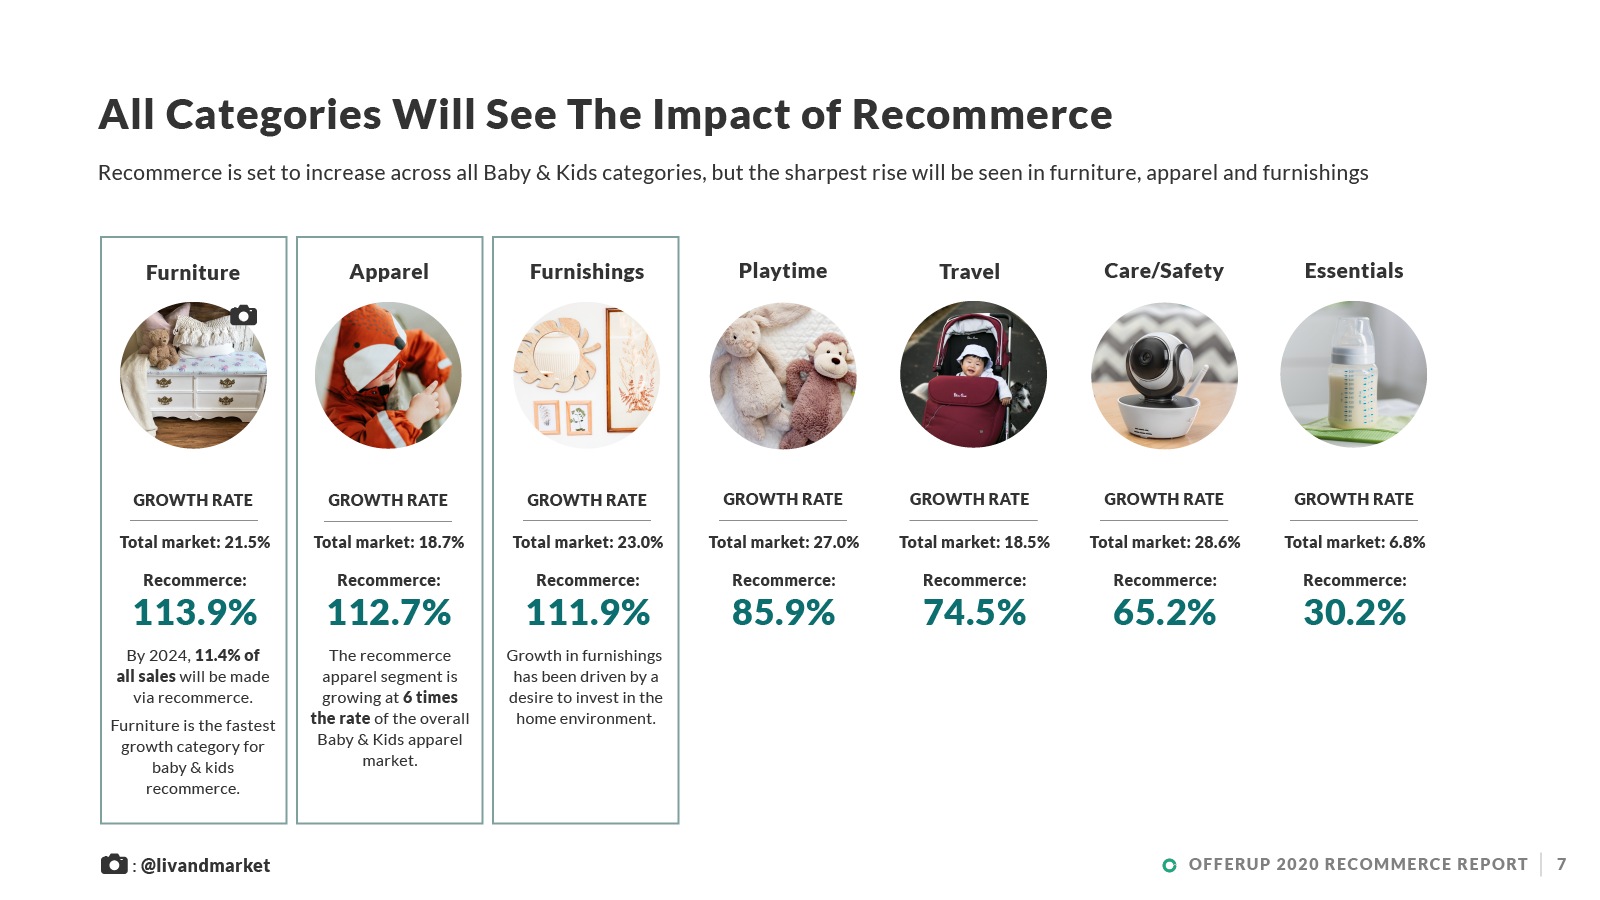
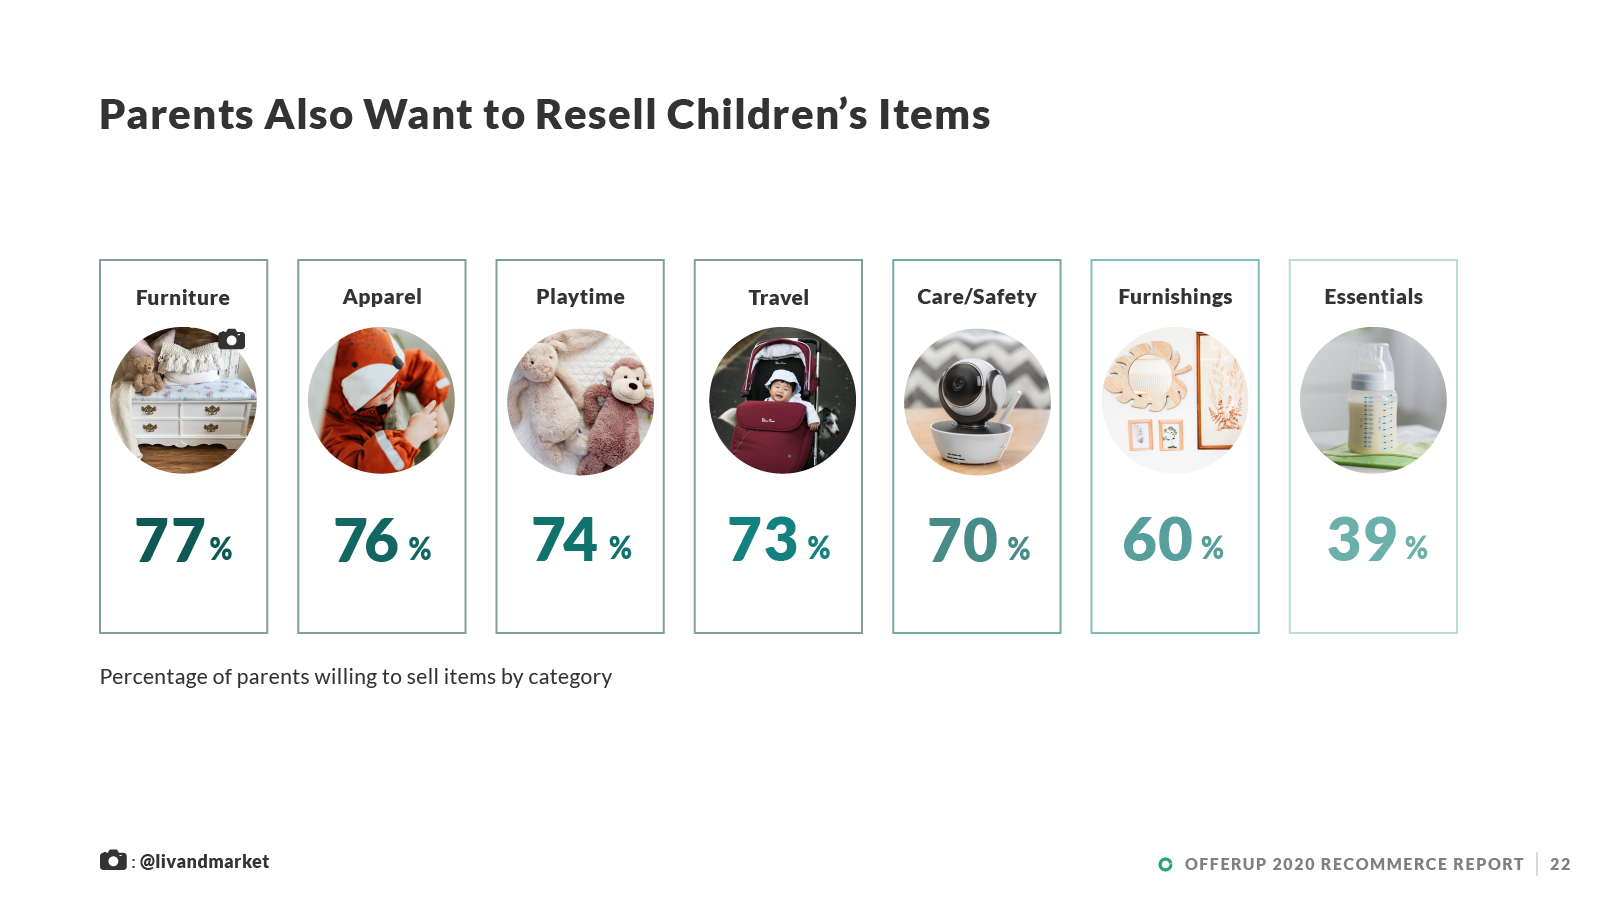
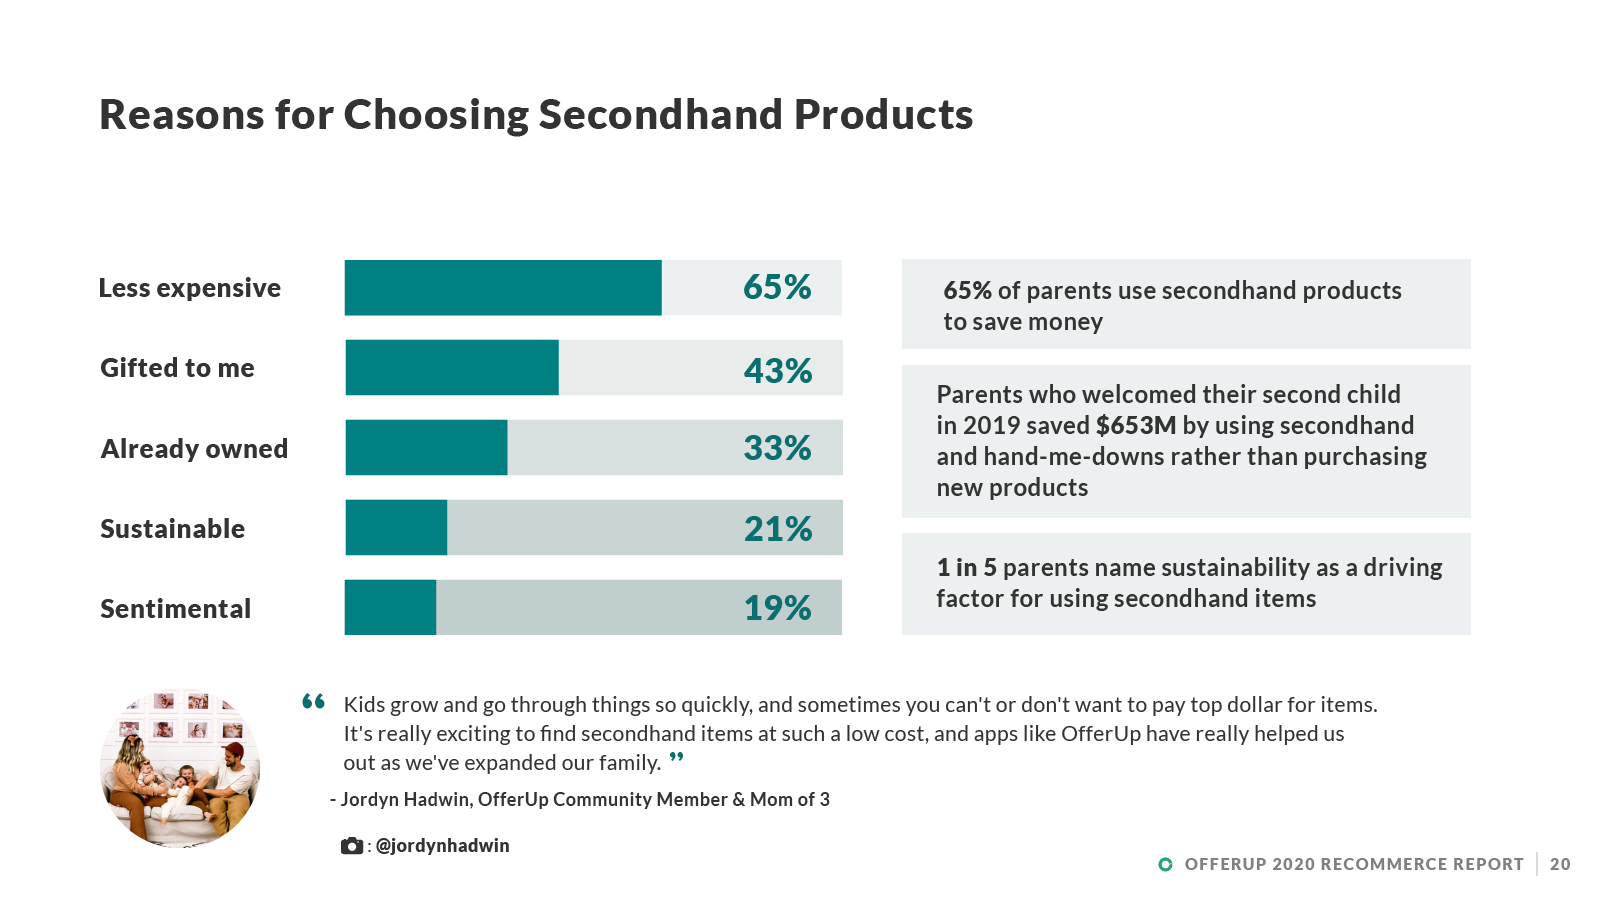
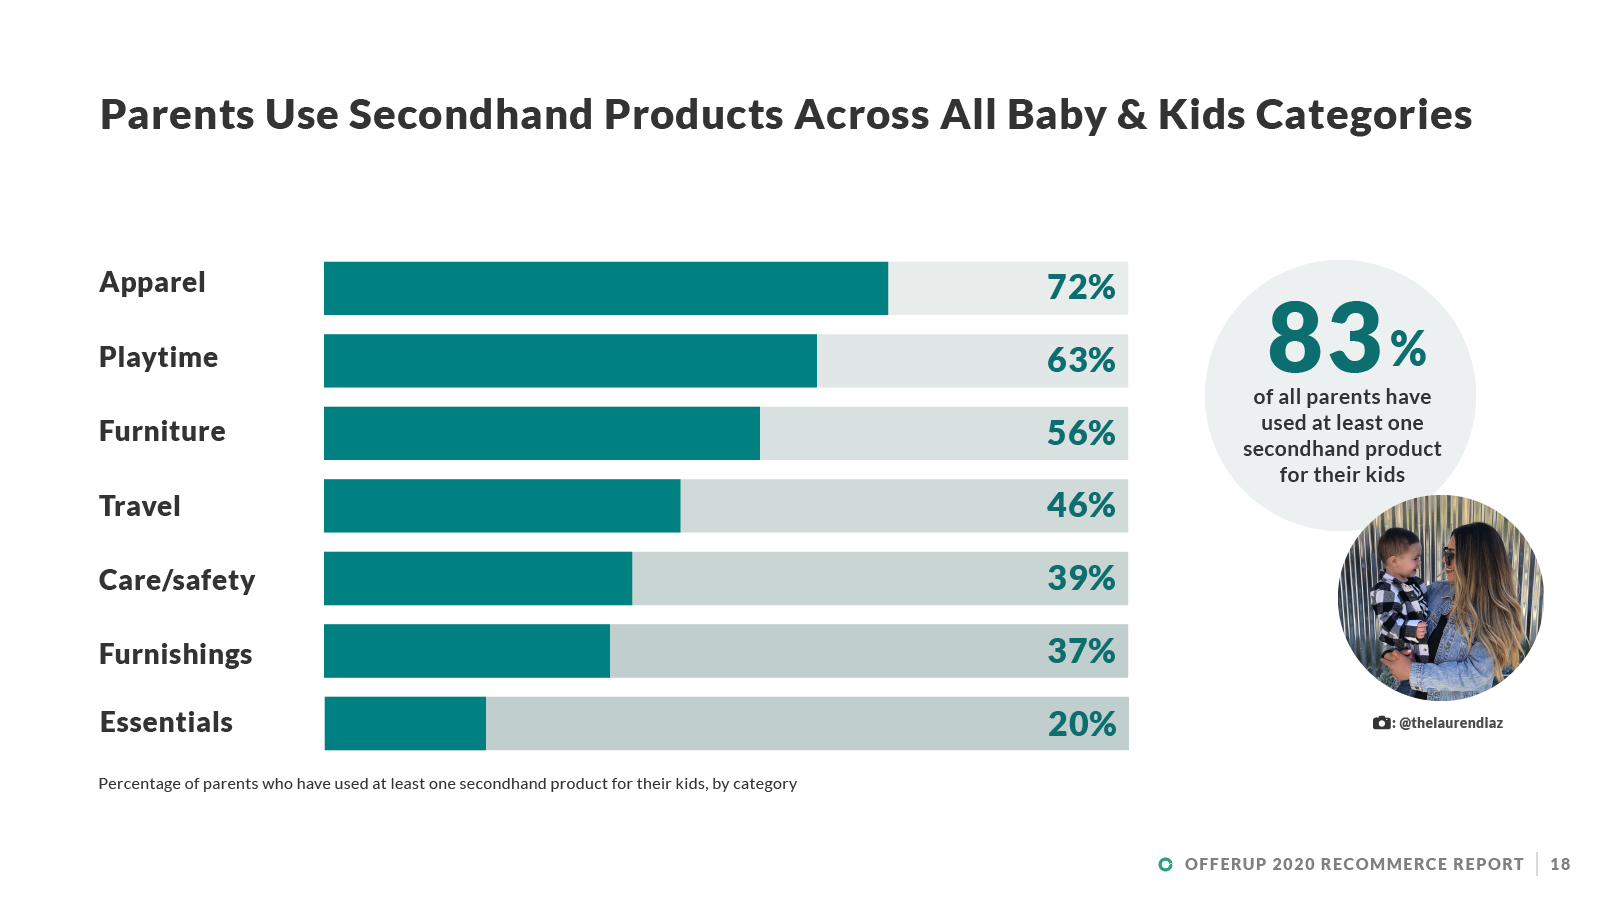
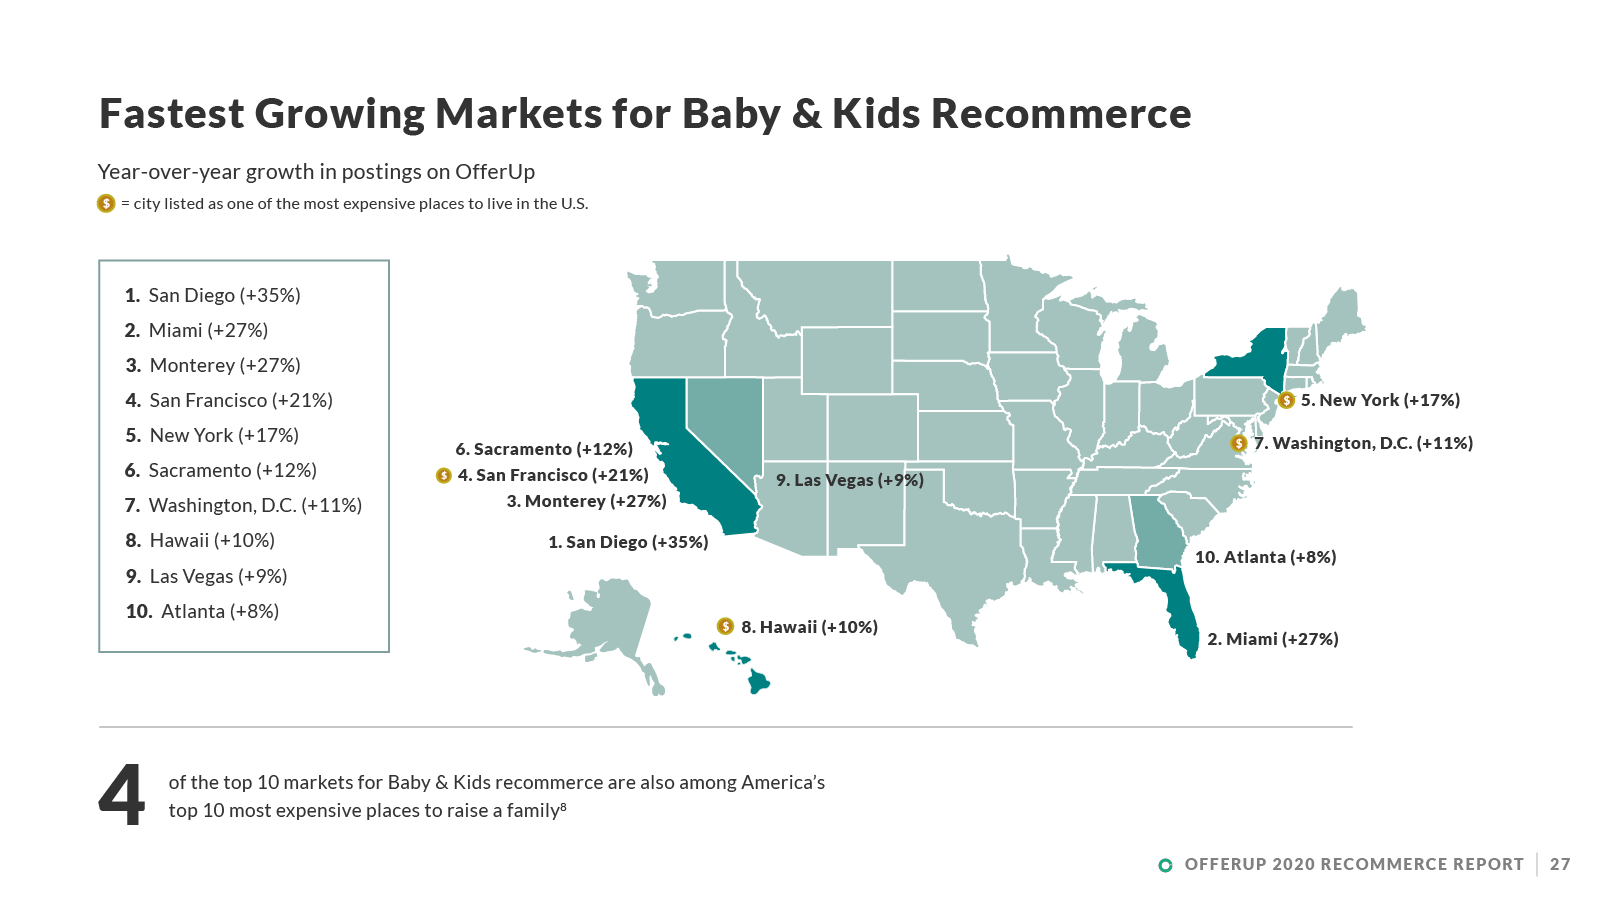
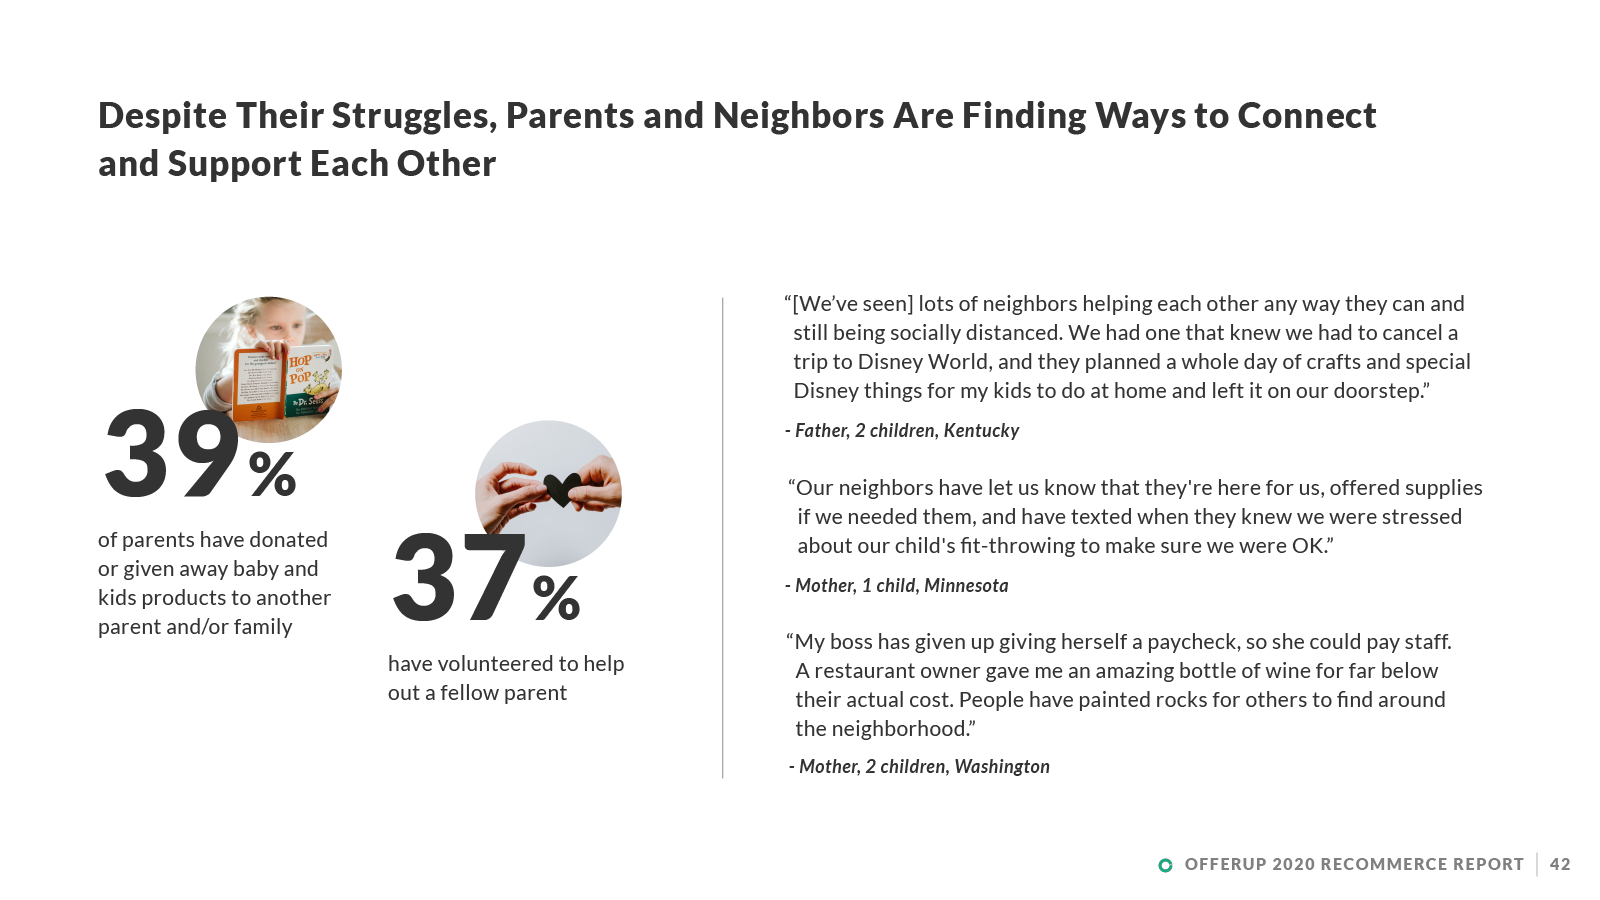
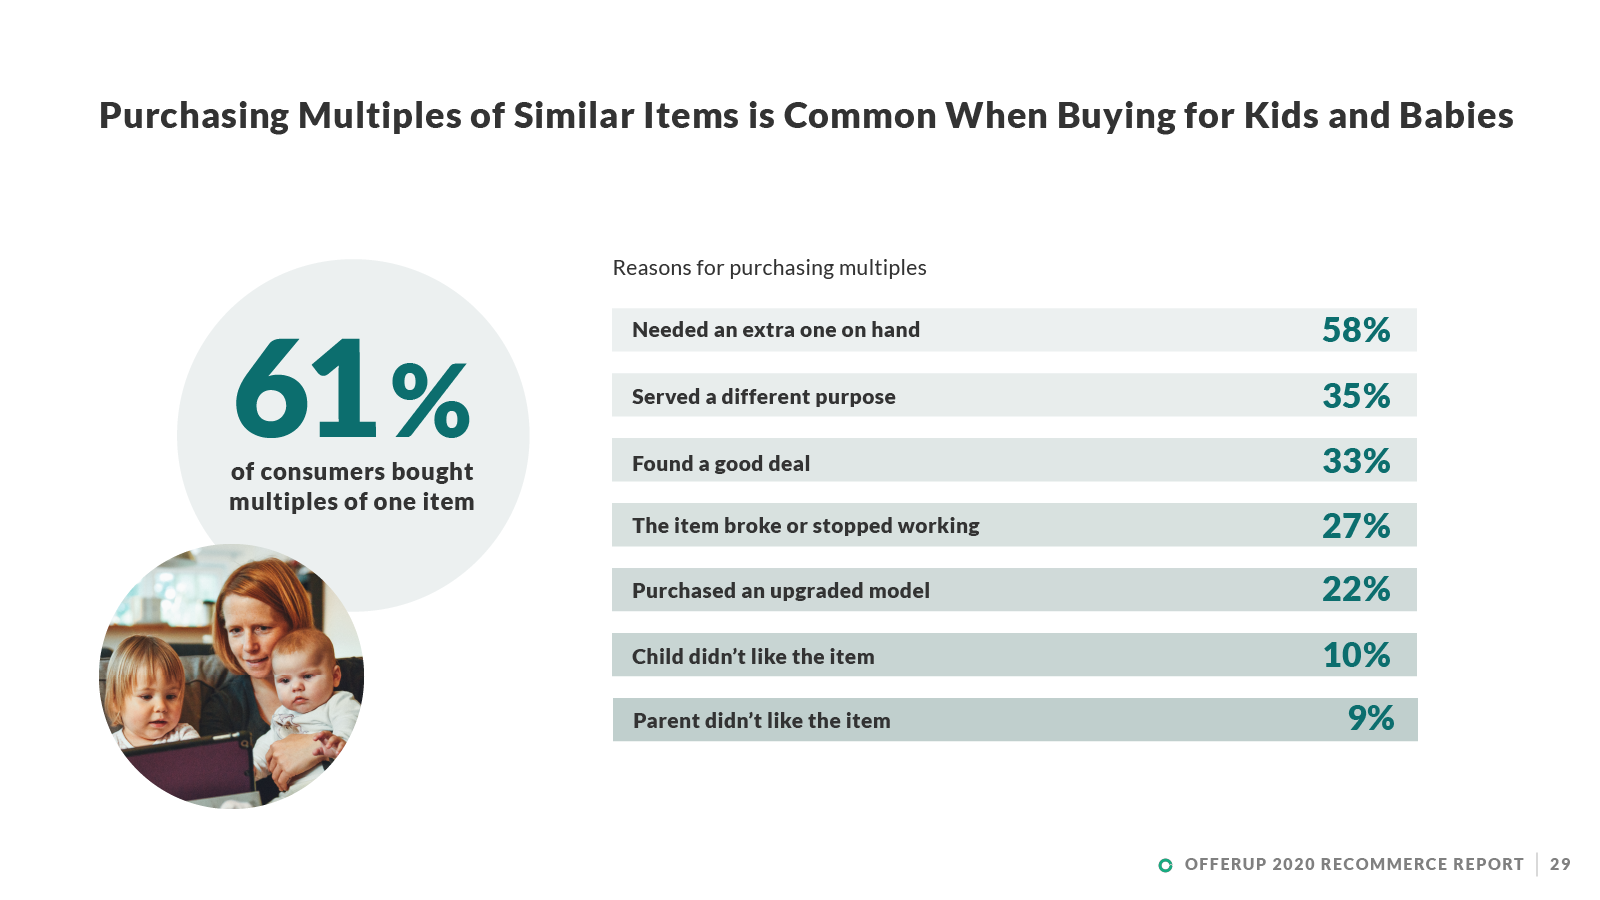
OfferUp started creating recommerce reports in the spring of 2019 to report on the state of reuse and secondhand trends in the US market. This year’s theme, Parents & Kids, centered around the different ways parents were using recommerce while raising children.
This report was picked up by and/or mentioned in CNN, NBC, PYMNTS, Journal Standard, and GreenBiz, often accompanied by interviews of our CEO Nick Huzar.

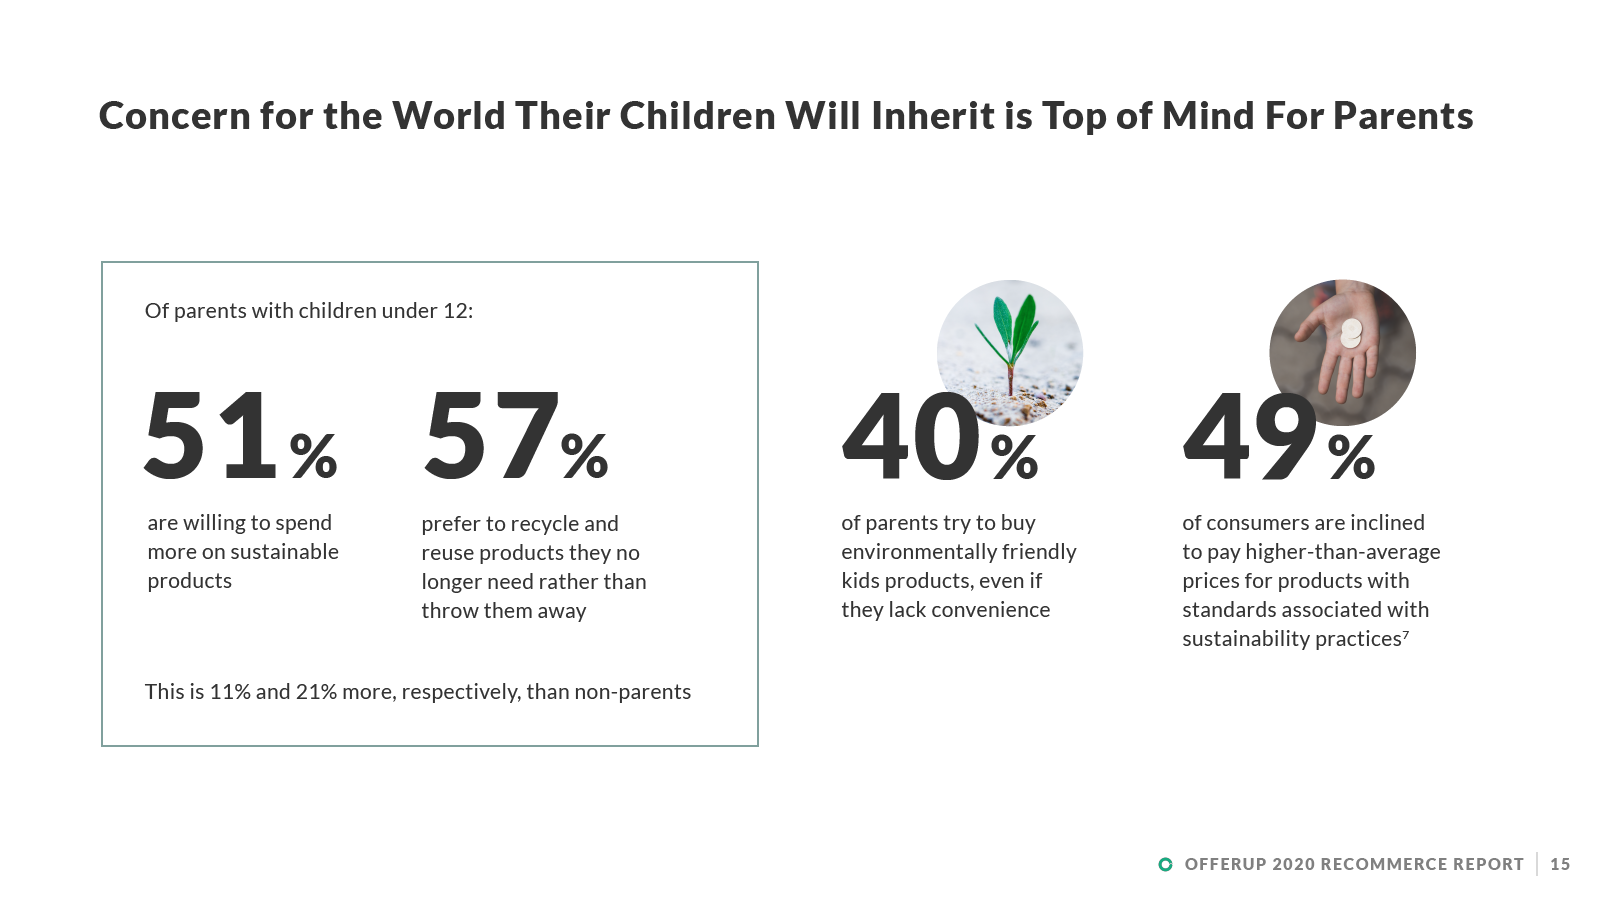
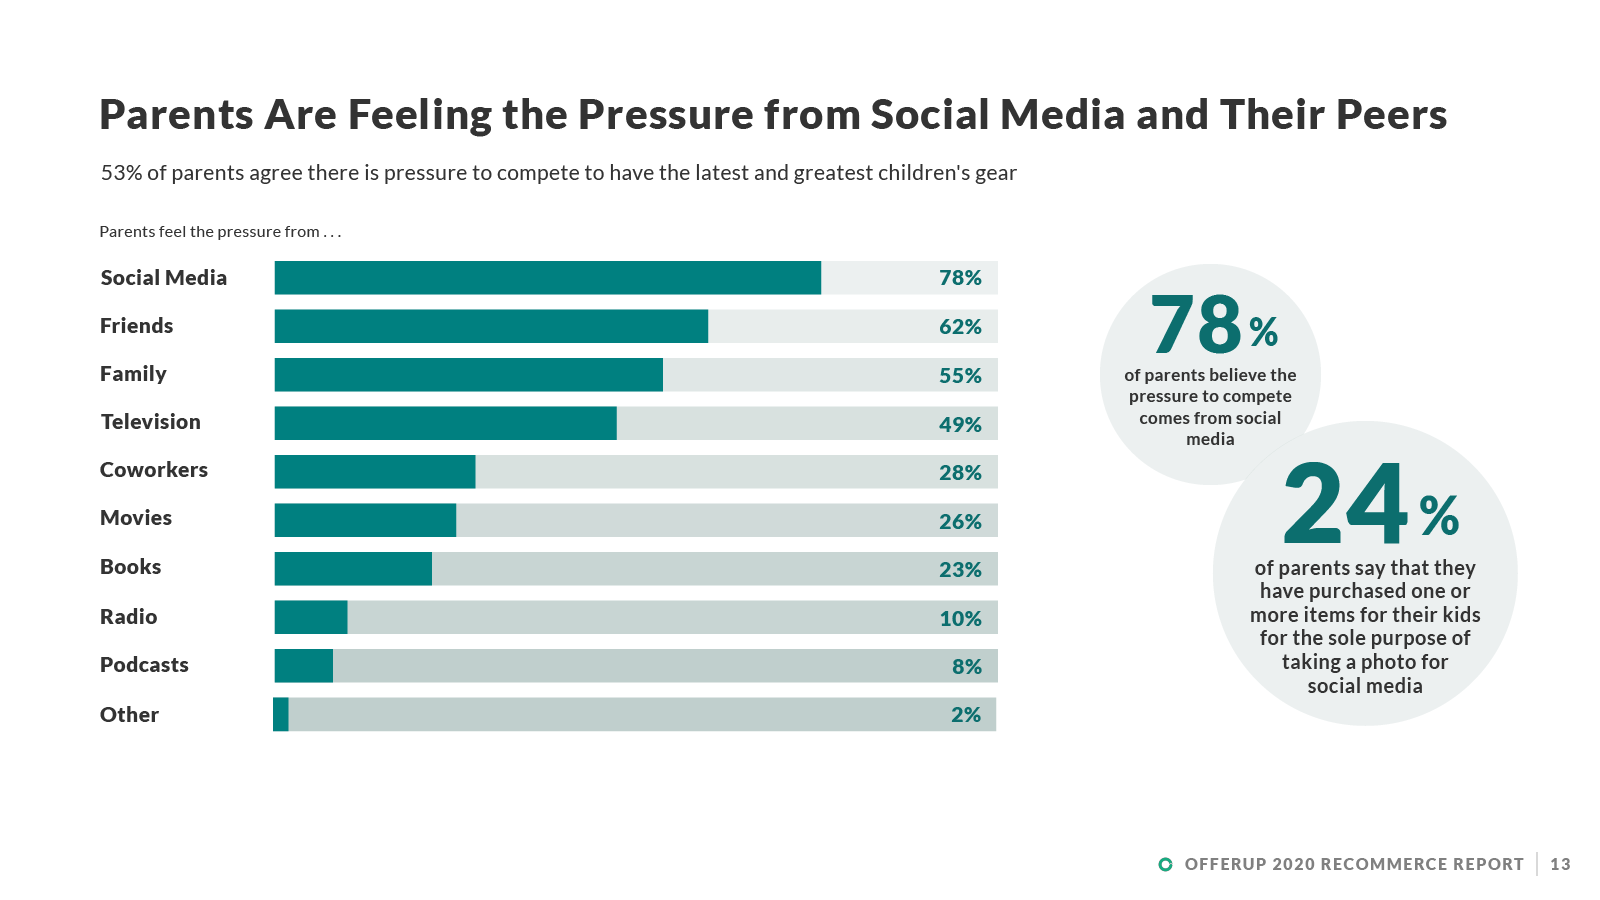
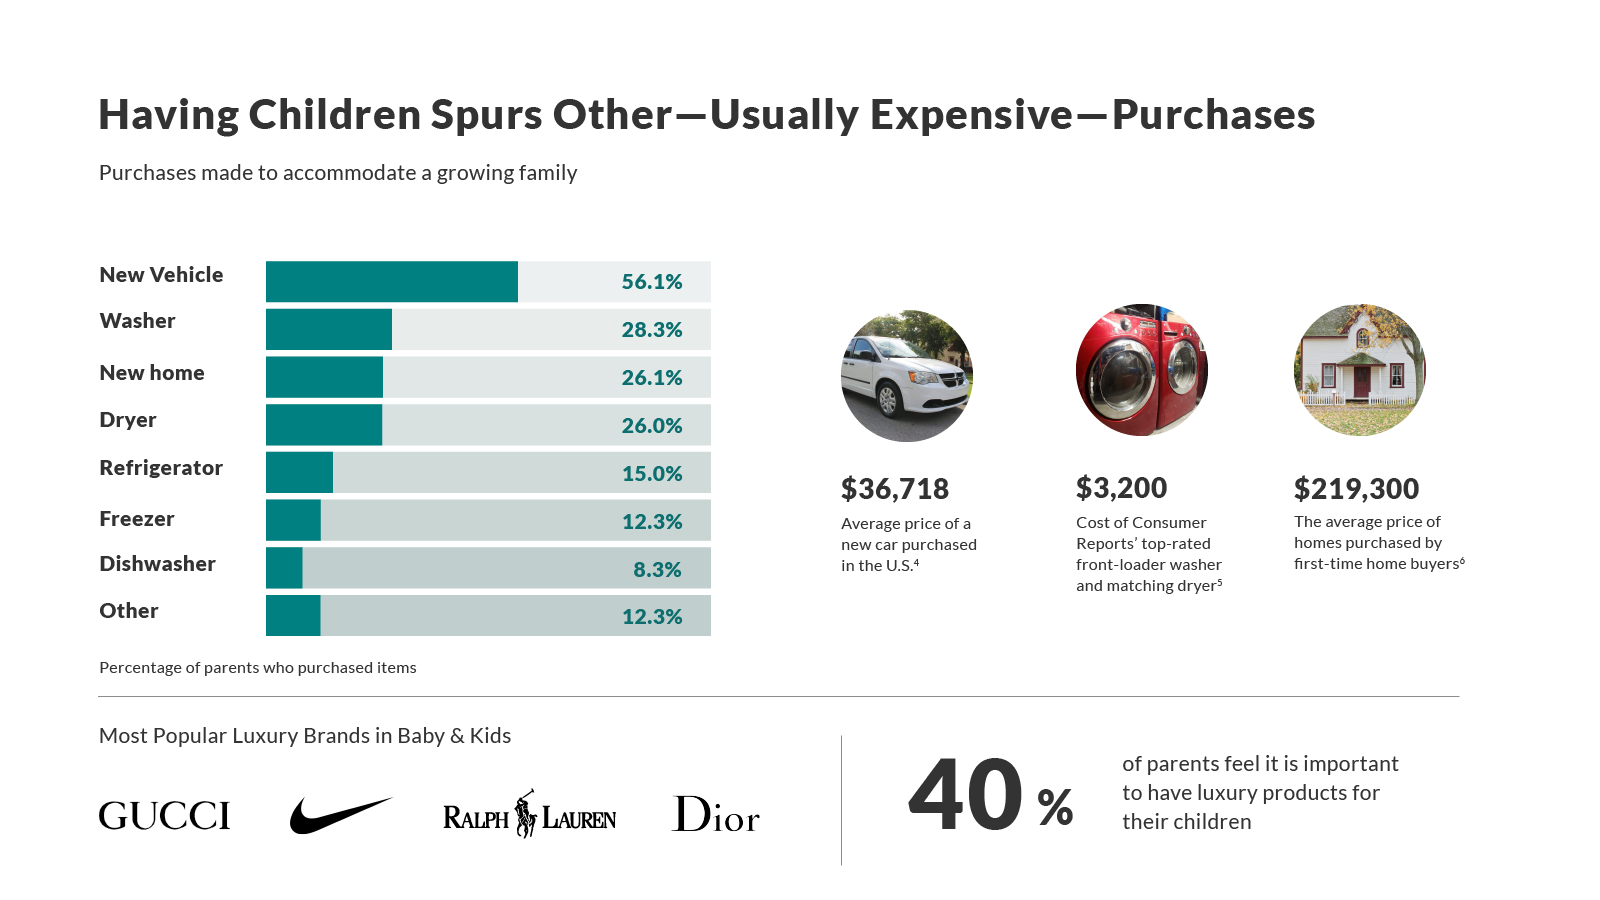
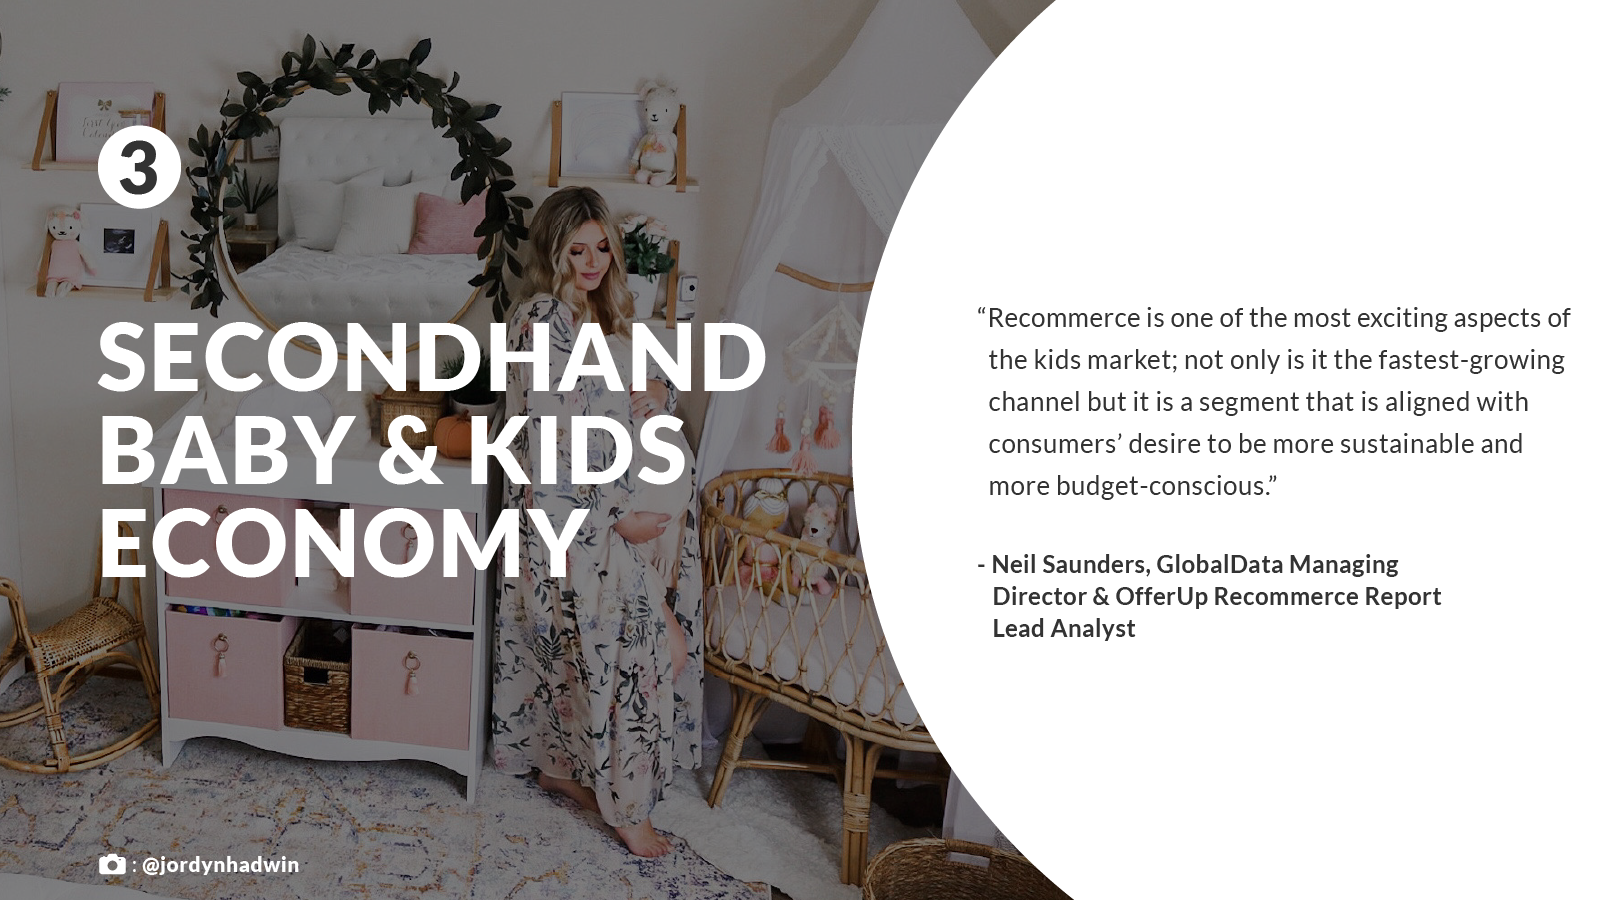
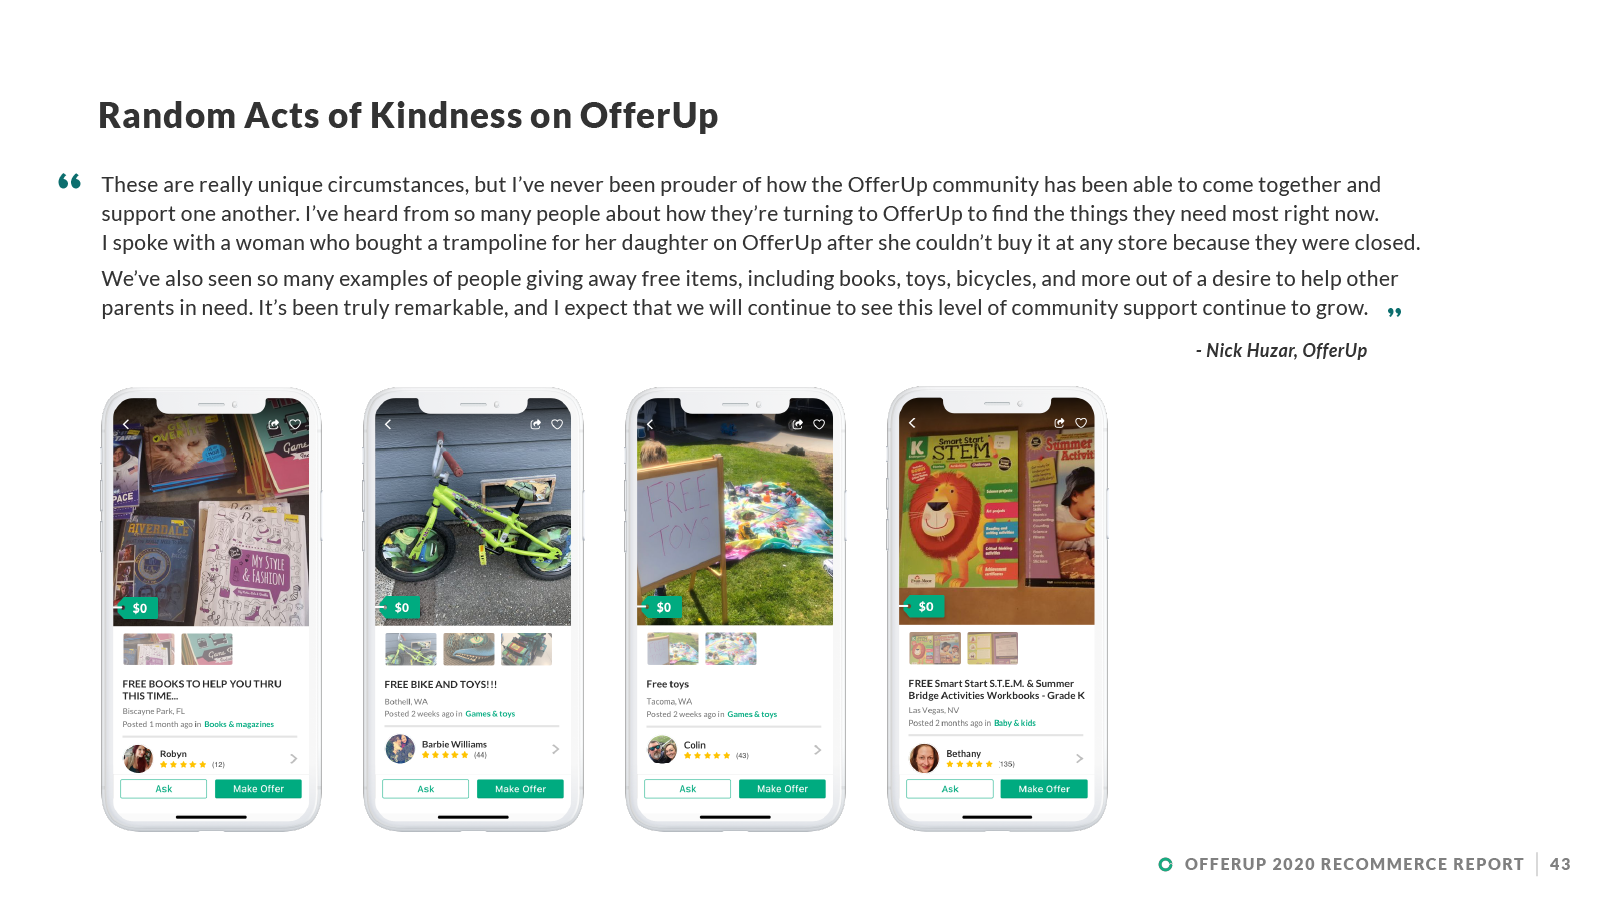
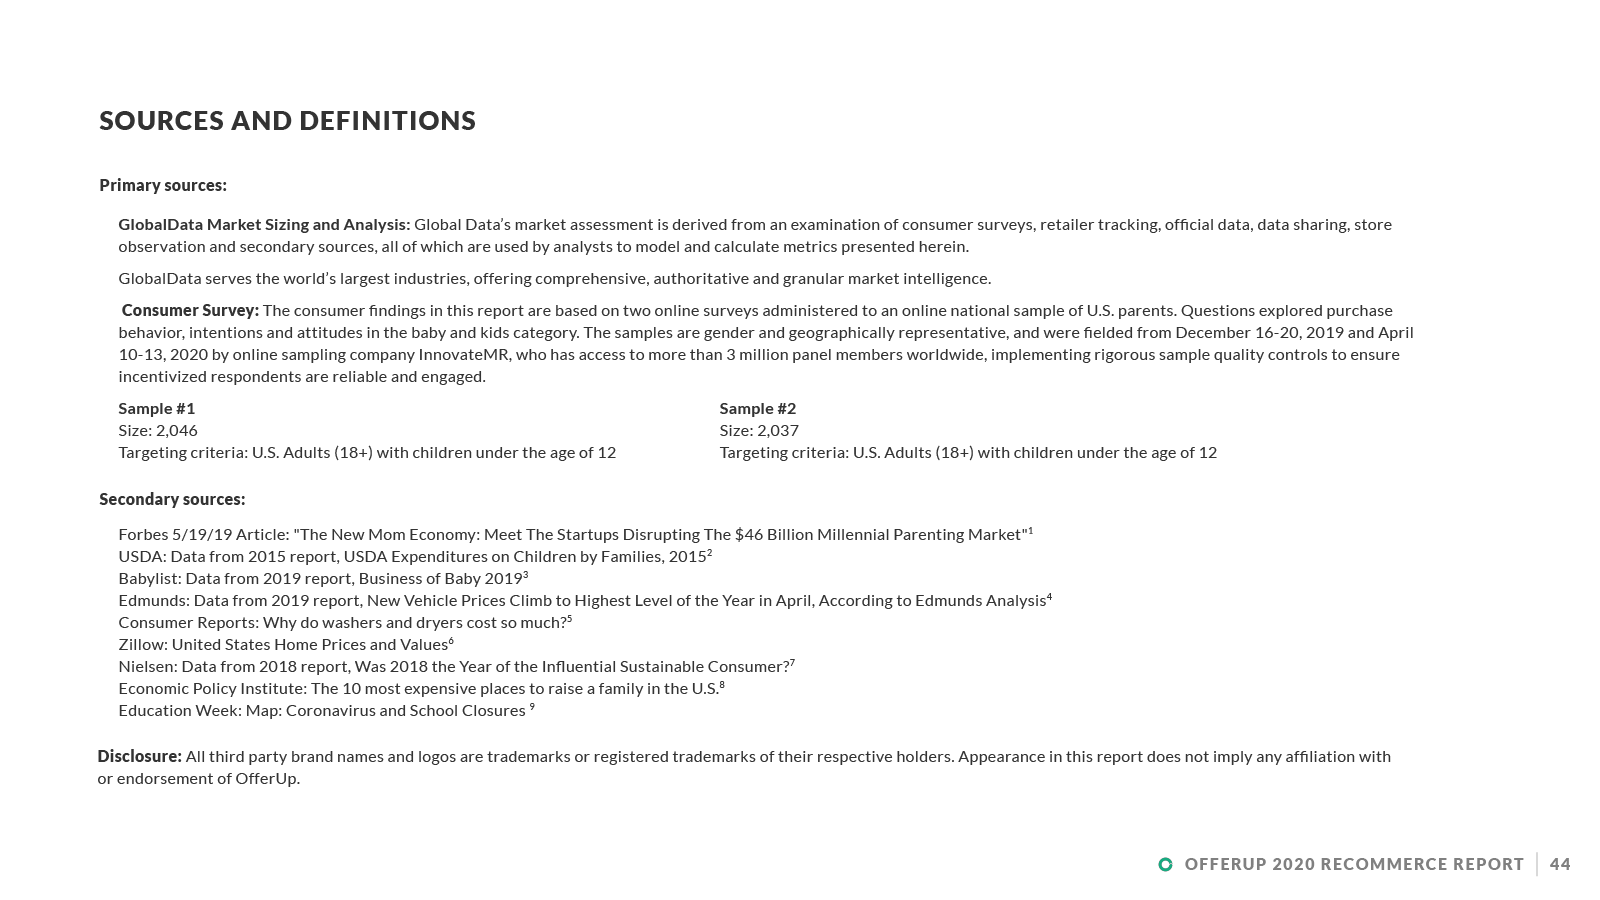
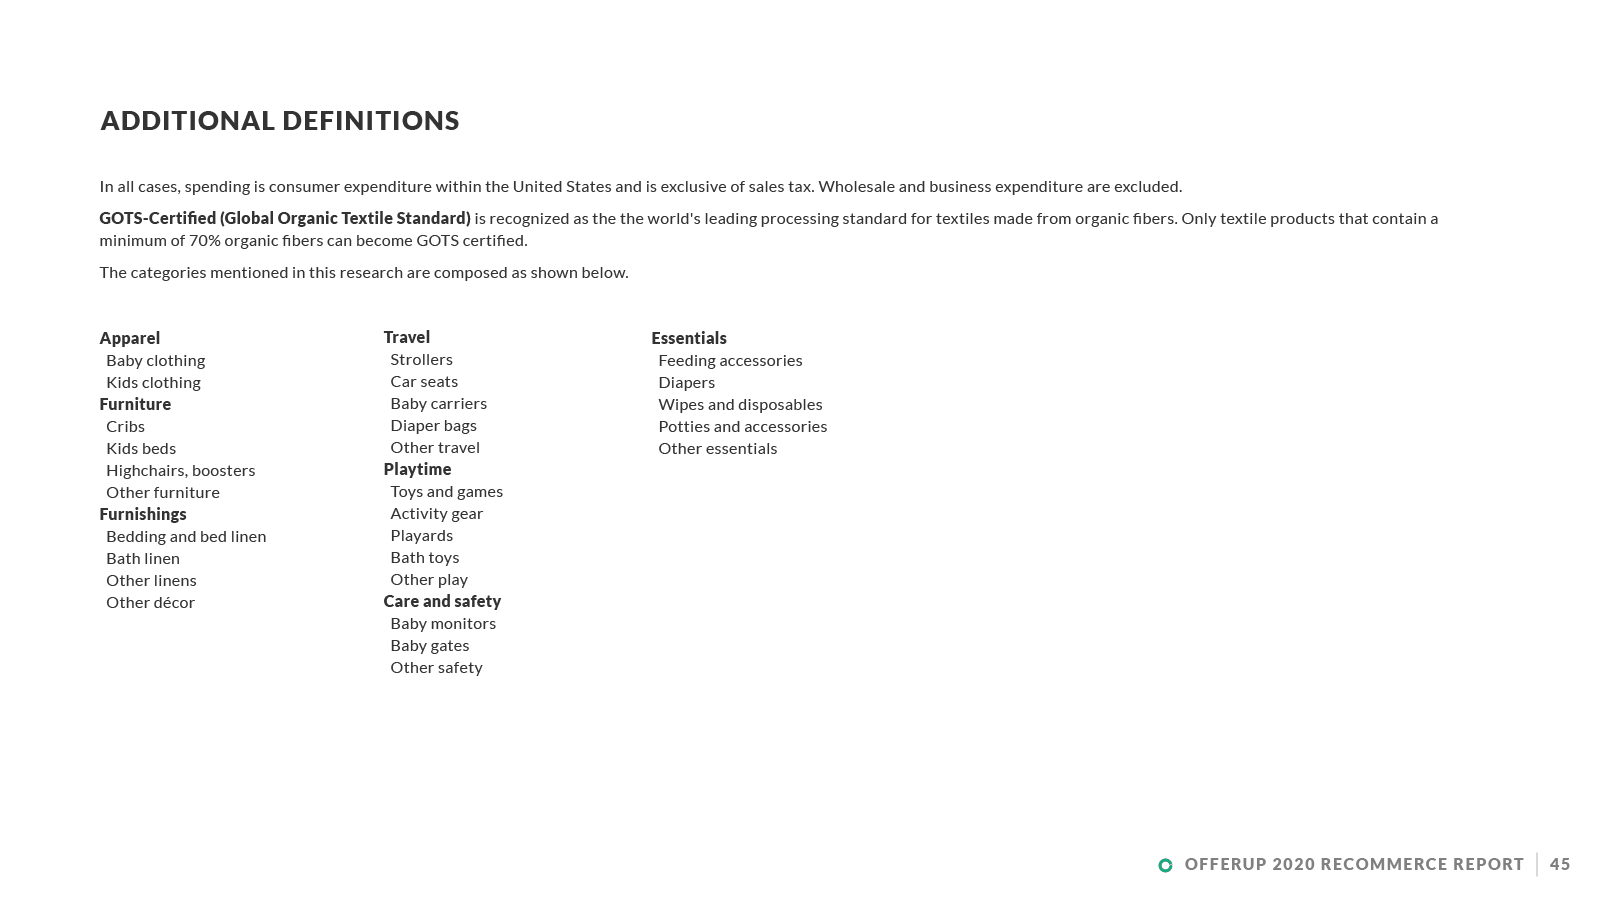
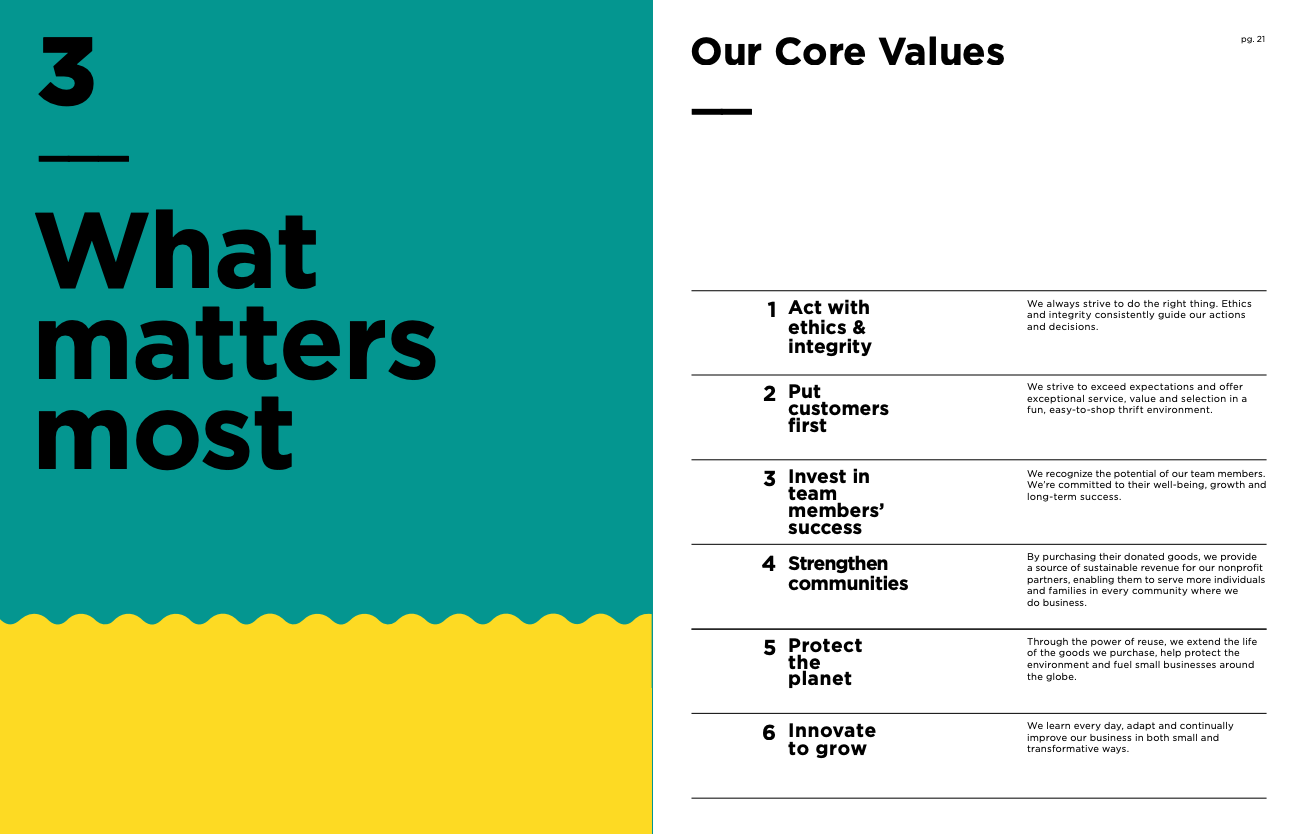
2020 Recommerce Report - Select Slides
To view the full report, download a PDF copy here.


Process and construction of the report
This report was originally scoped at about 12-14 pages, but after gathering the data for the project, it quickly grew to 38 pages. The time constraint to create the art direction, guidelines, and execute the design was only 3 weeks. For the sake of easy artboard moving and quick edits to the graph-heavy document, our two-person design team chose to create the report in Illustrator. We were considering InDesign originally, but scrapped the idea when we found that it took too long to quickly illustrate graphs in InDesign, and we needed our typography to be very flexible depending on the page.
We set to work pulling inspiration from other competitor reports, and creating a styleguide for our report.
Inspiration & Competitor Examples
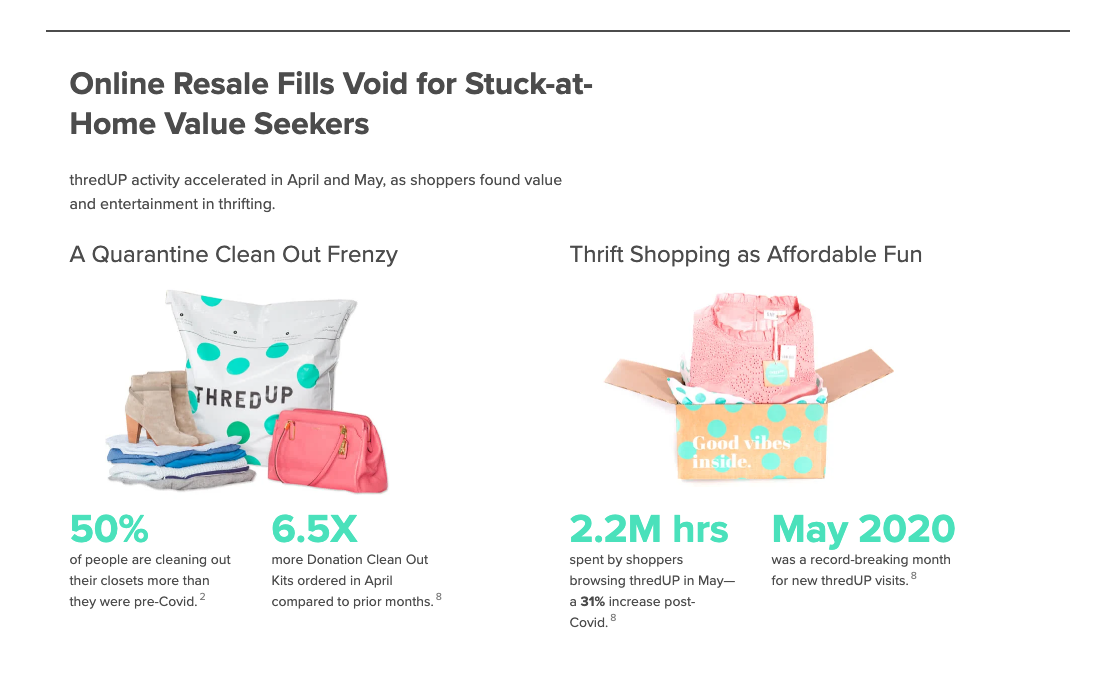
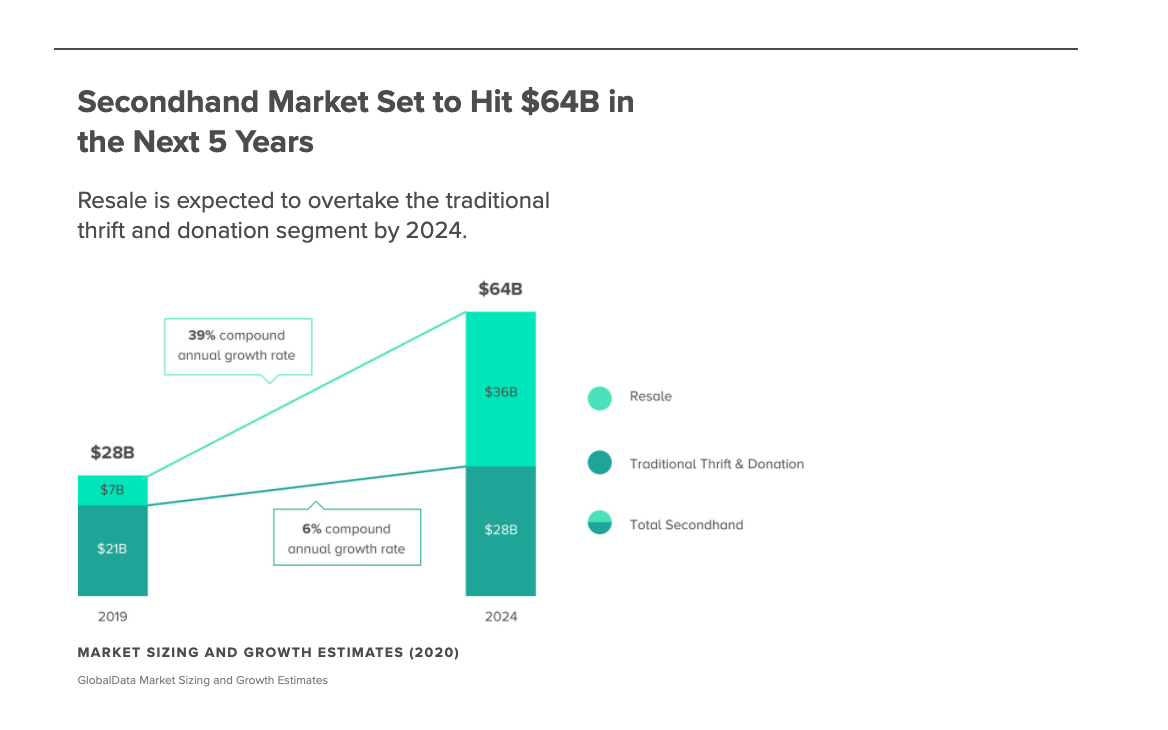
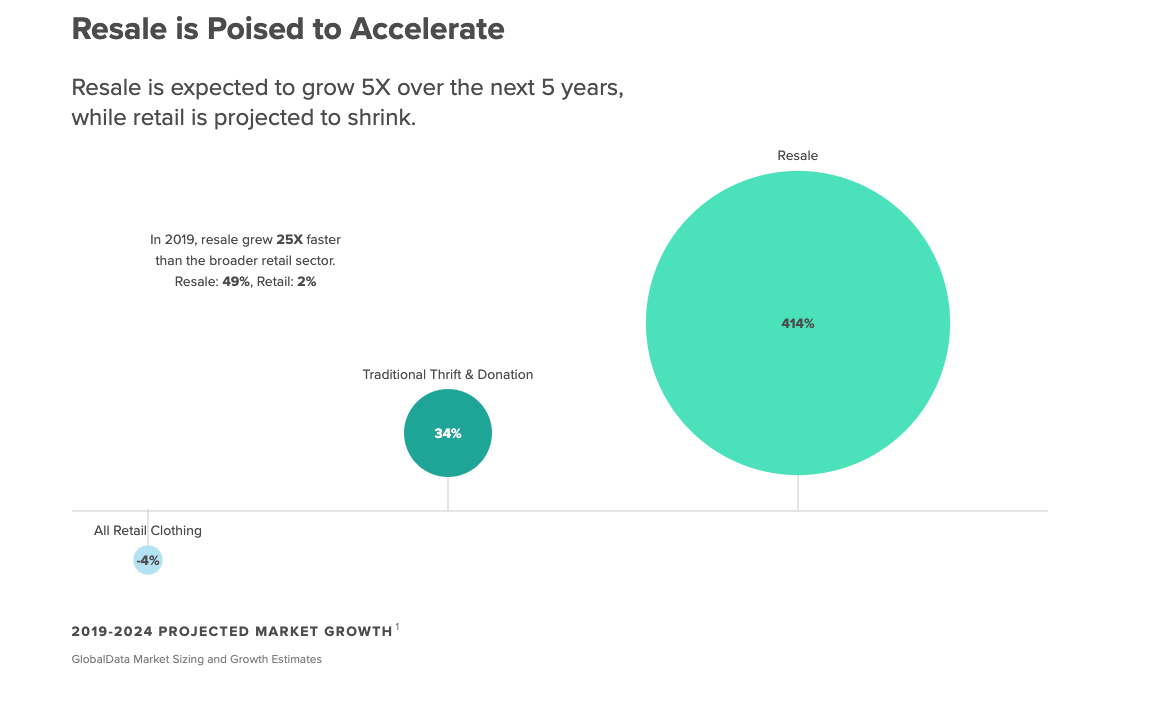
ThredUp Fashion Resale and Market Trend Report
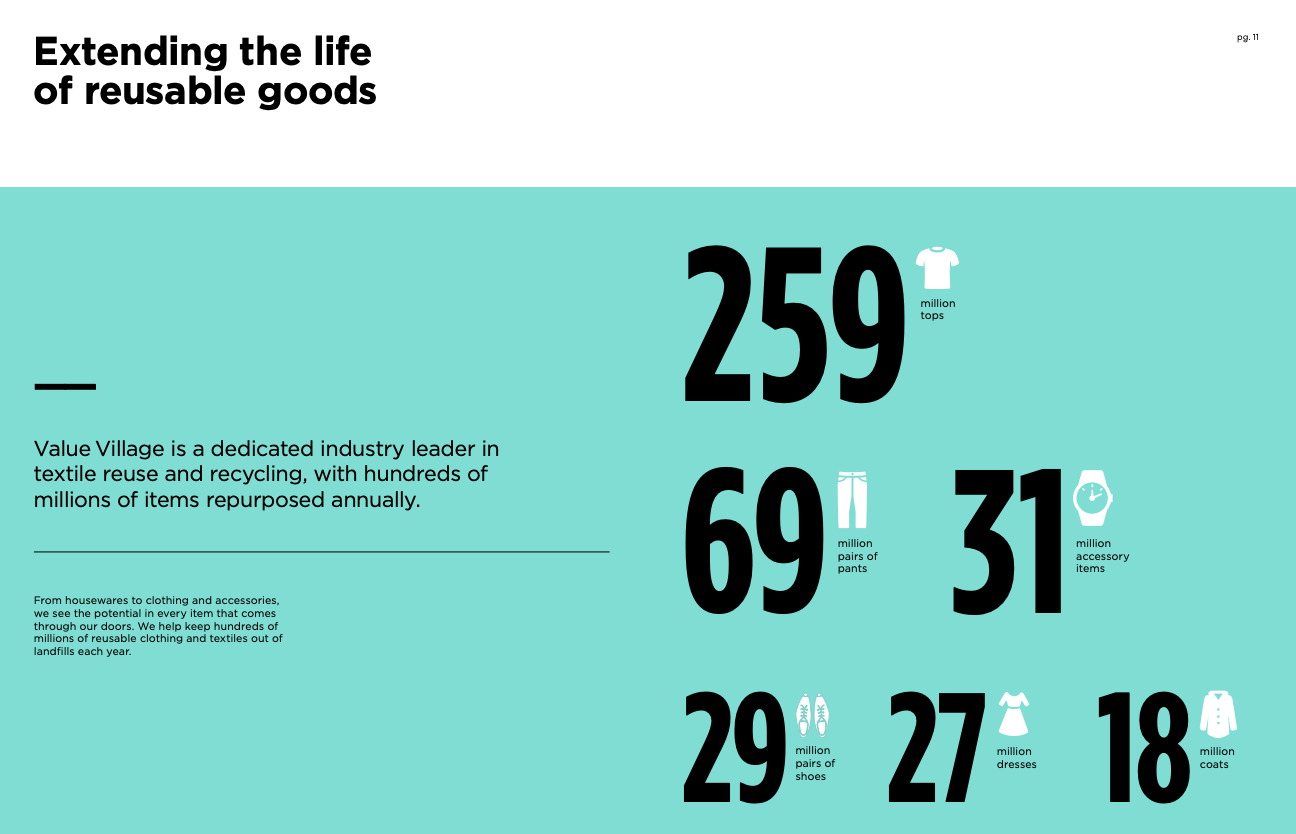
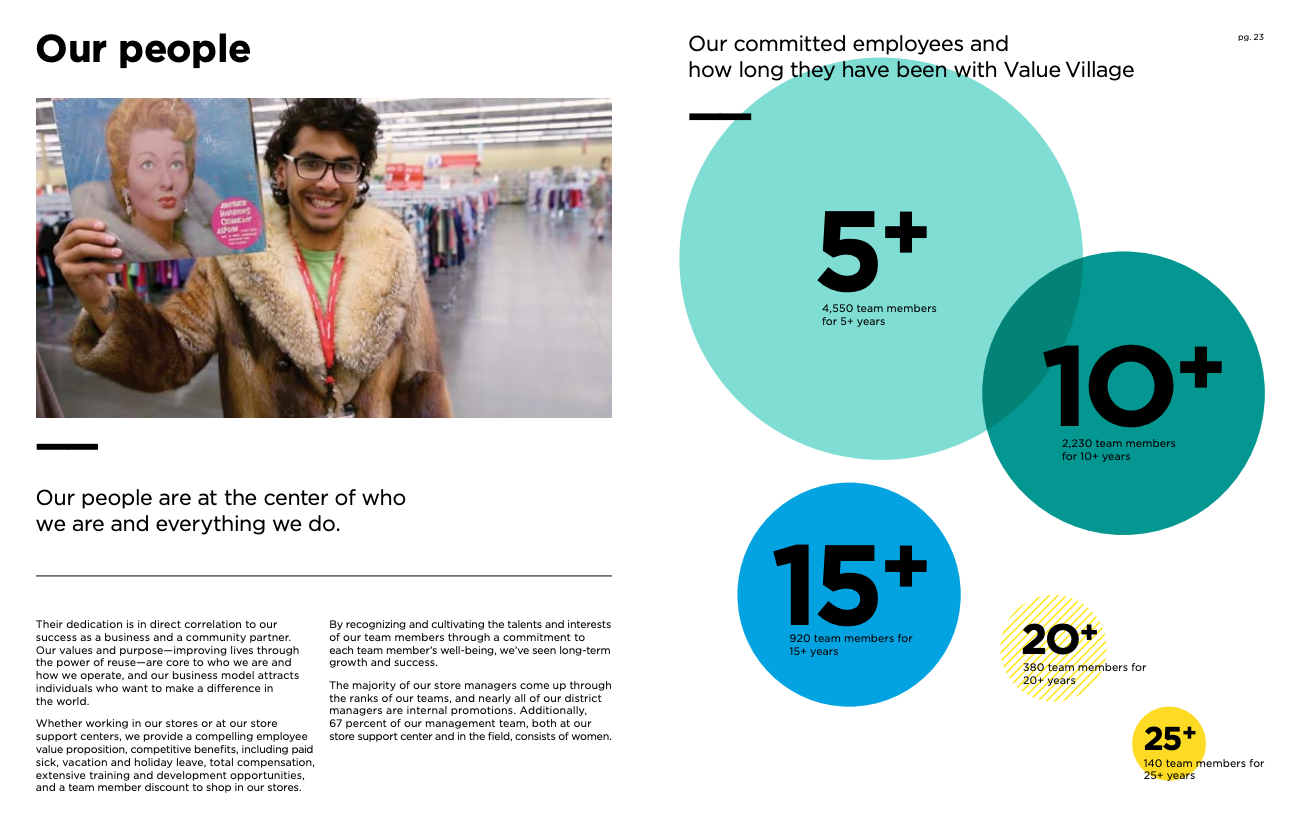
Value Village State of Reuse Report
Working process
We quickly identified a color palette and varying type sizes to work from. We chose a muted blue that complimented our brand green as our main color theme – a color that felt soothing and modern. Since there were so many graphs in the report, we wanted to pick colors that wouldn’t fatigue the eye after scrolling through 30+ pages.


After our two-person team established the overall look of the report, I took over from there in setting the grid for the pages. Since I was working in Illustrator and not InDesign, I wanted to make sure the grid was rock-solid.


Unexpected changes
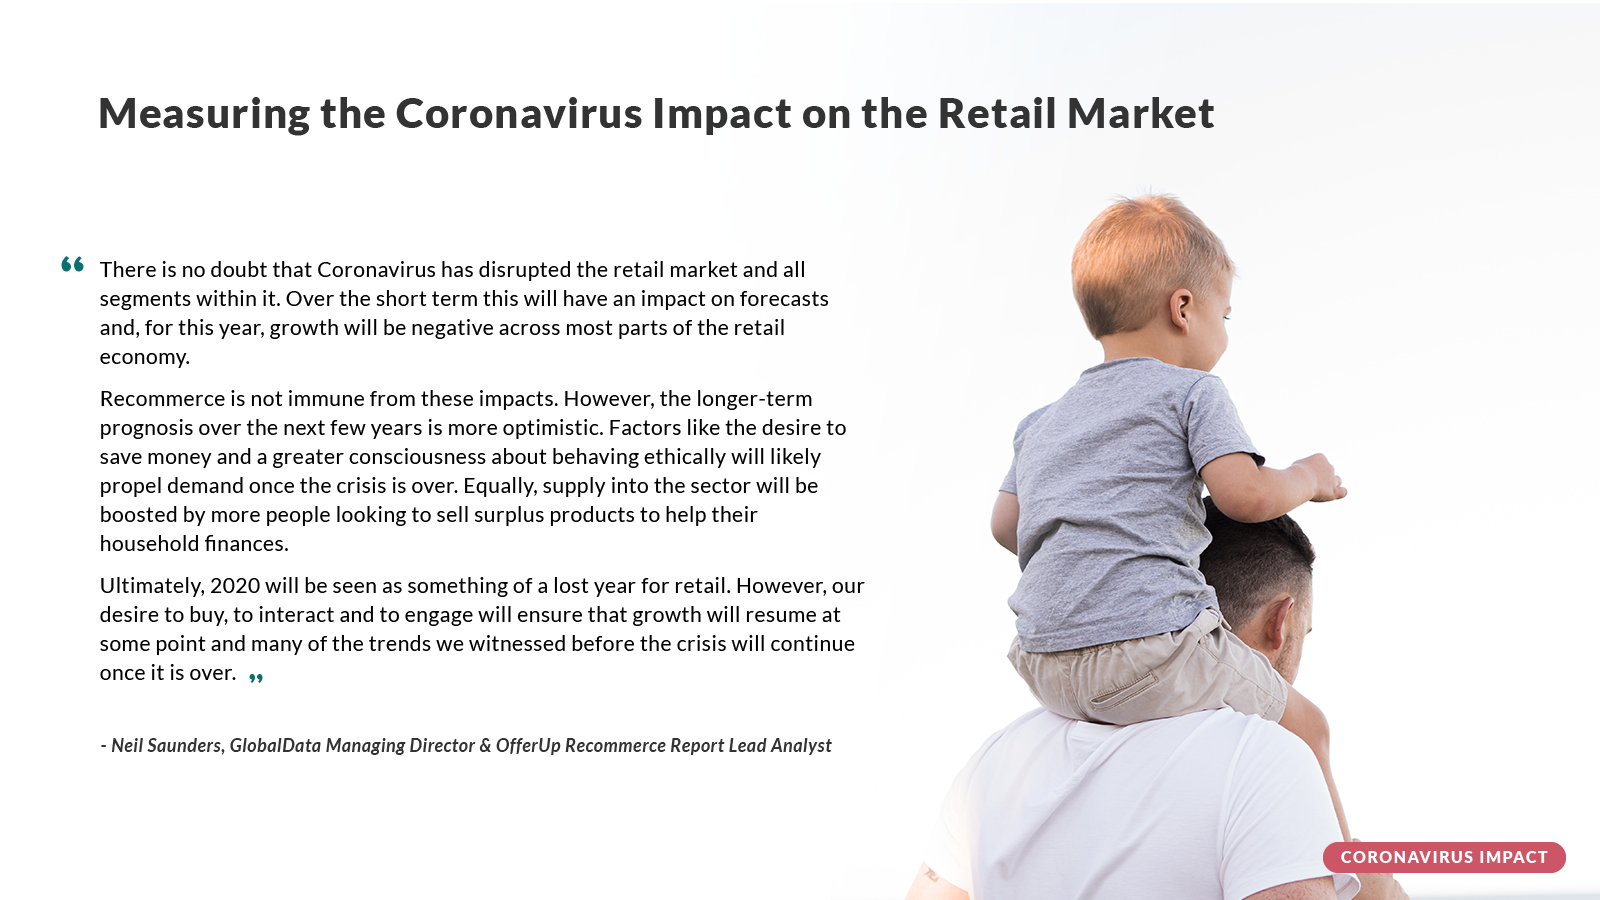
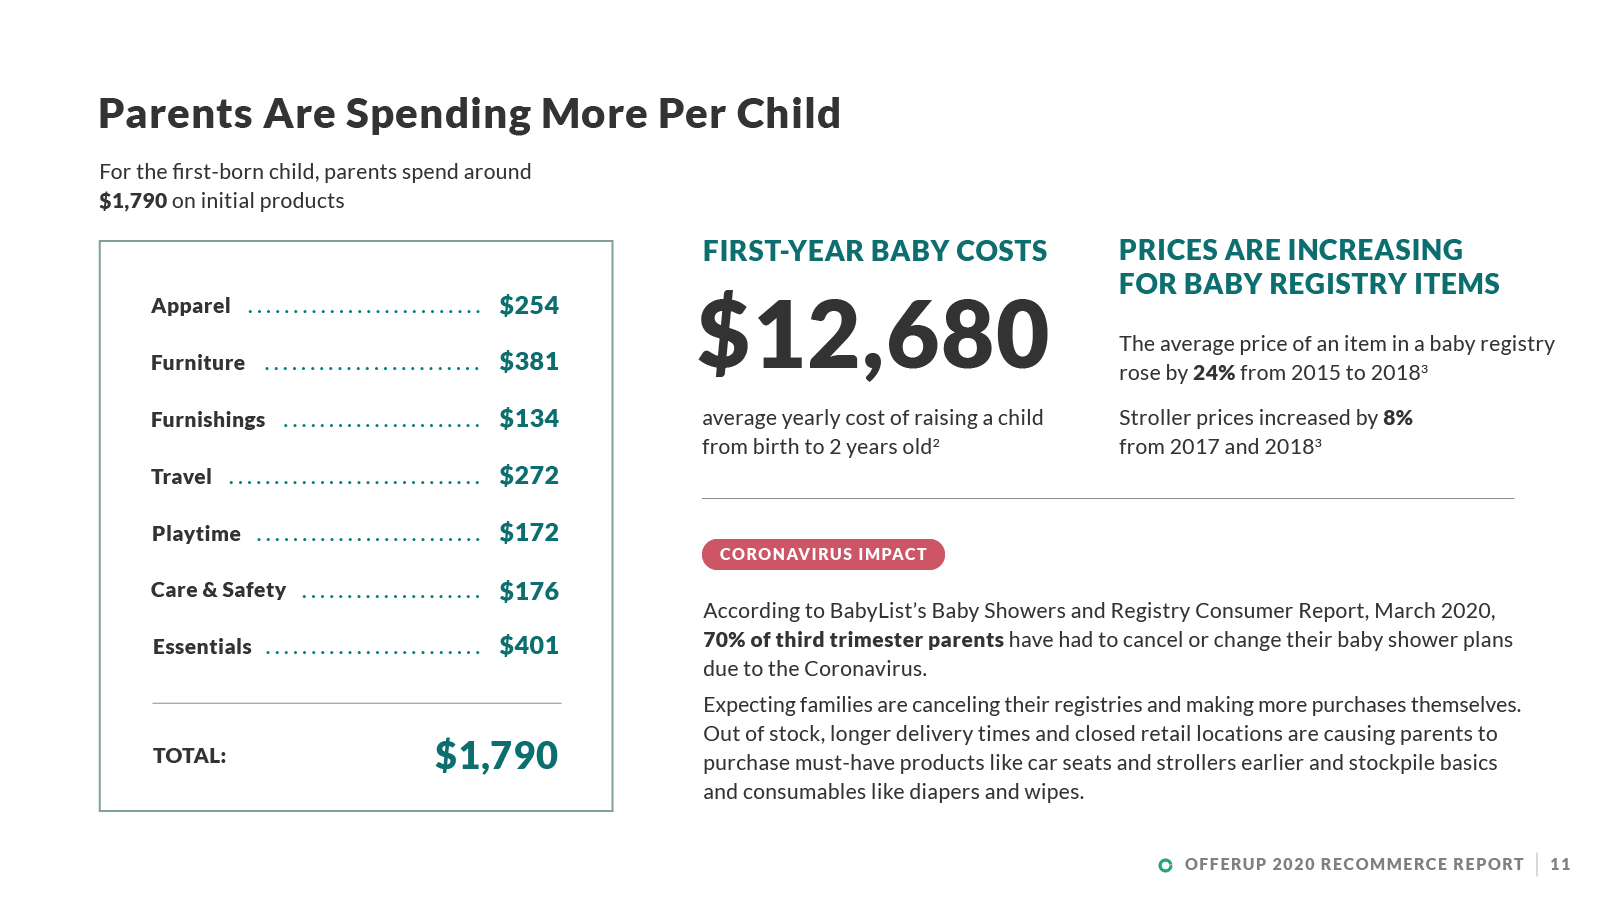
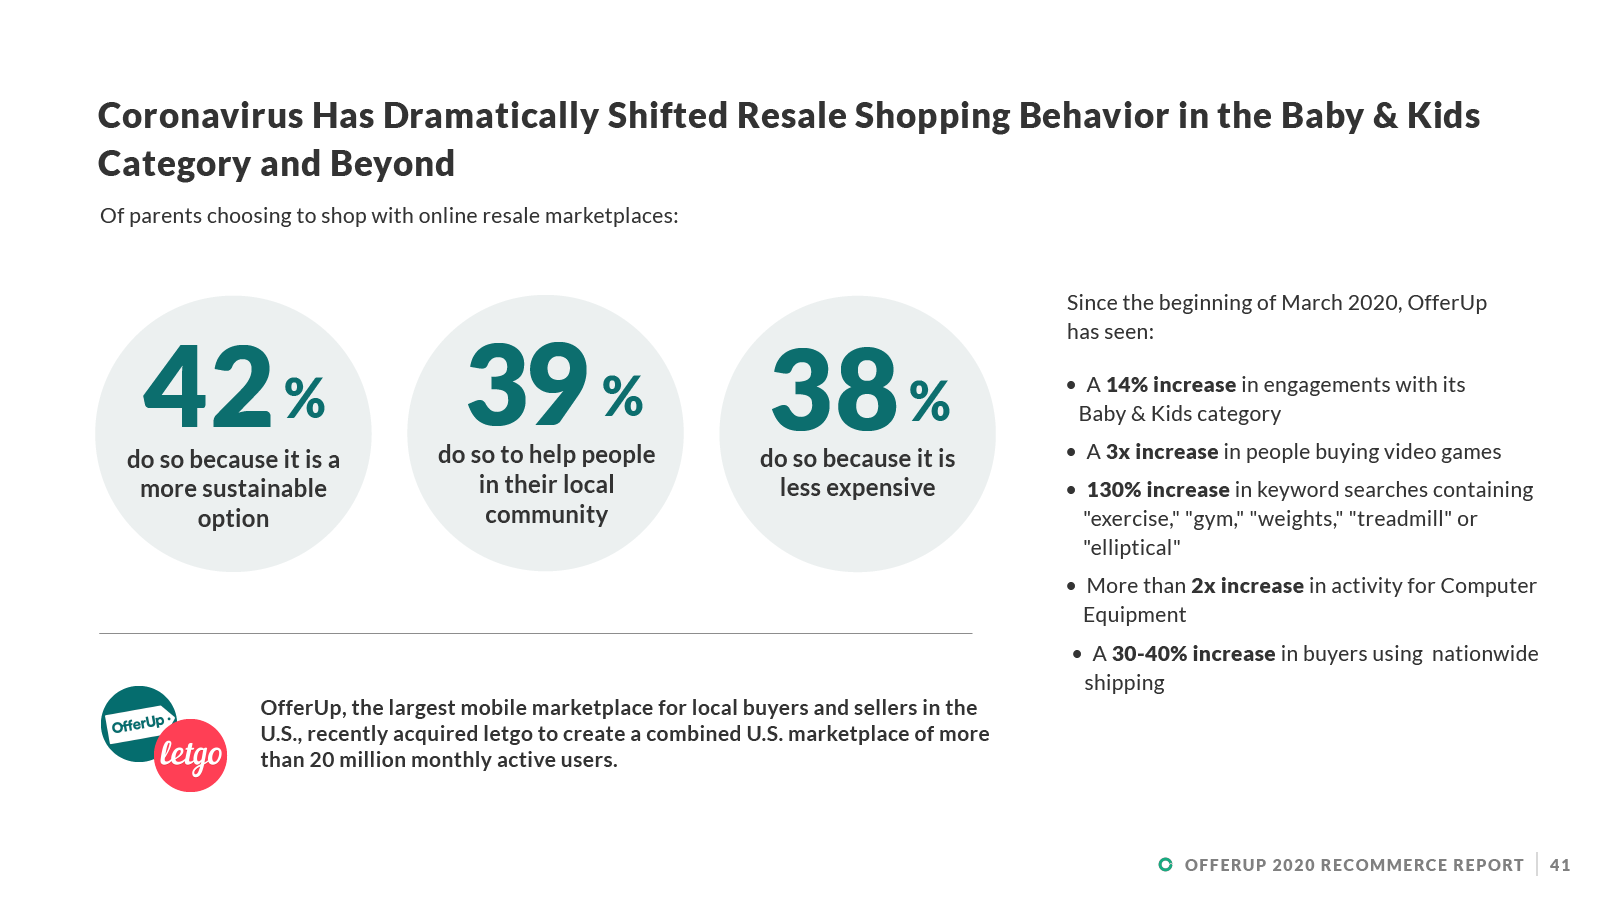
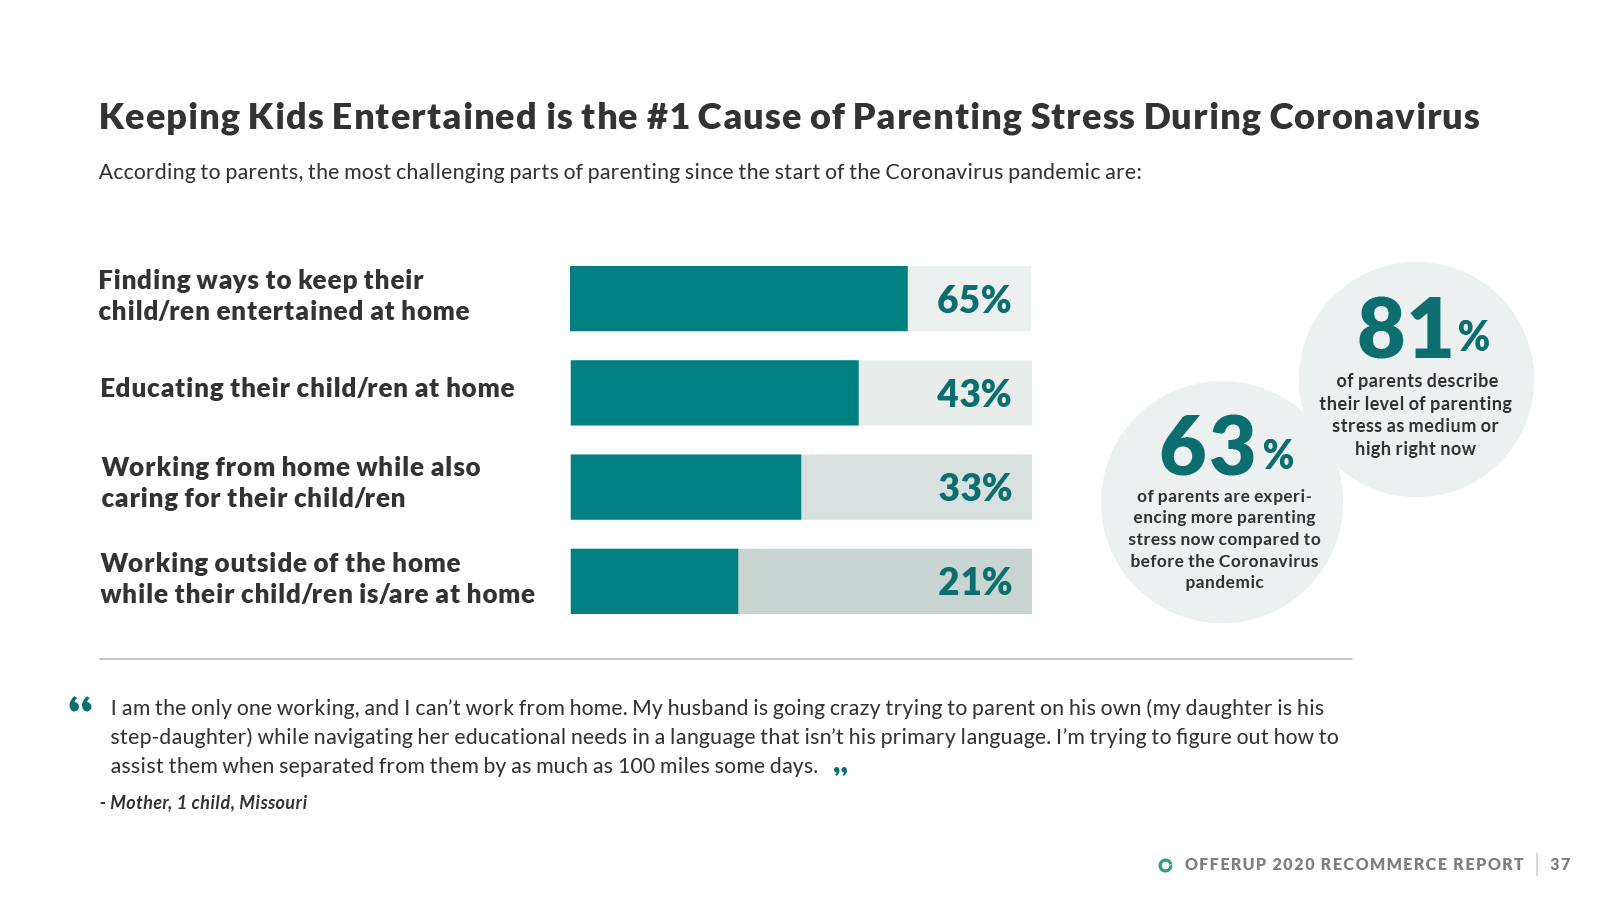
This report was originally set to be published in early March, but was pushed back to a late April release because of the COVID-19 pandemic worldwide. We ended up adding an additional eight pages to the report that included information about how coronavirus was impacting families across the US. This change brought the total number of pages in the Recommerce Report up to 46 pages, including more edits to existing pages to clarify what data was pre-COVID and what data had changed.
Final thoughts
I’m extremely happy with the way this report turned out. It was a team effort at the beginning, but the rest of the design and construction of the report was my work. I also created most of the social and PR graphics, and transposed graphics to a blog post in Medium.
In the future, I don’t think I will try to create a deck of this scope in Illustrator again. While it was nice to have the freedom to move quickly when illustrating and placing type, InDesign may have saved me more time in setting a grid, setting my typography, and ordering pages.
The media pickup of the 2020 Report was sizable, especially considering the flood of COVID-19-related news that would have otherwise overwhelmed the report. Although the pivot to adding new content was stressful, I’m glad we ended up adding the extra content around coronavirus impact.
